One comment the Skeena Knowledge Trust gets a lot is that the size and scope of the Skeena Salmon Data Centre can be overwhelming. The Skeena Salmon Data Centre (SSDC) is a comprehensive, central repository and data hub for credible information related to wild Pacific salmonids in the Skeena watershed, including data on salmon populations, habitat, water quality, hydrology, and climatology. It has a powerful search engine and data logging capabilities based on open-source software, but with over 1,000 datasets and counting it can be a bit intimidating for the uninitiated.
To help users become more comfortable using the SSDC, the Skeena Knowledge Trust has developed several self-help tools including the Help Pages, instructional videos, and a frequently asked questions page in addition to offering customized workshops and seminars. Through our partnerships with Smithers-area conservation groups in recent years and with generous funding support from Lush Canada, REFBC, and the Wetzink’wa Community Forest, we have been able to go the extra mile and create dashboards for specific watersheds which summarize the information available on the SSDC, integrate provincial water quality monitoring results, and serve it up in a simple, easy-to-use webpage.
Our What’s in my Watershed dashboards are now available for Seymour Lake, Lake Kathlyn, and Tyhee Lake. All three lakes serve as drinking water sources for residents as well as being popular recreational destinations for swimmers, paddlers, ice skaters, and many others. The Seymour Lake Conservation Society, Lake Kathlyn Protection Society, and Tyhee Lake Protection Society are all active community groups focused on preserving the health of their respective lakes for the enjoyment of all.
The format of the What’s in my Watershed dashboards was designed to be easily replicable while allowing room for customization. Each dashboard provides a summary of information for each watershed and highlights any historical or ongoing concerns affecting the lake. These concerns can include water quality, weed growth, invasive species, or drainage issues. This case study uses the Tyhee Lake What’s in my Watershed dashboard as an example, but all the dashboards follow a similar format.
Dashboard Description
The first page presents an overview of the watershed, identifies major land uses, lists fish species present, and provides some summary statistics including lake area, elevation, and depth. An interactive map shows the outline of the watershed catchment basin with inflow and outflow streams.
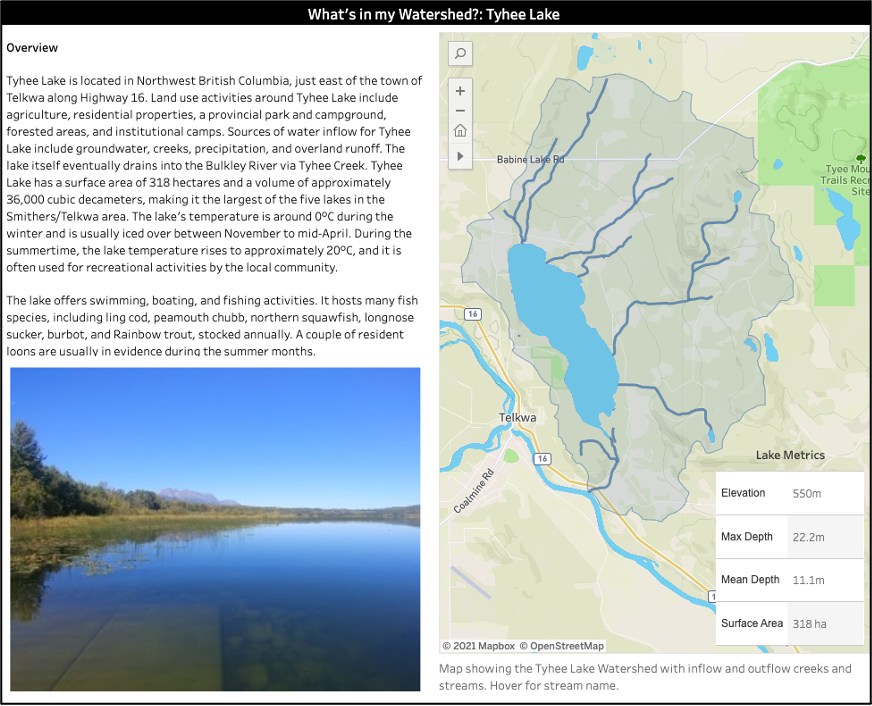
Overview of Tyhee Lake Watershed Dashboard
The second page provides links to information sources and a summary of current and historical concerns for the lake.
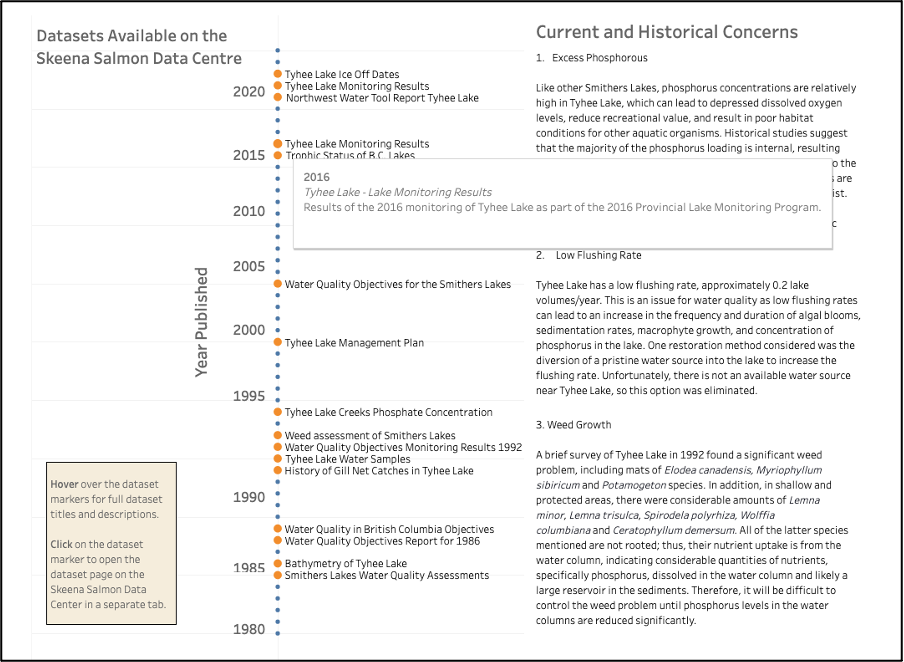
Summary of Available Information Dashboard
The orange dots on the timeline represent publications on the SSDC; using your mouse to hover over the orange dot brings up the tooltip box with the full name of the report and a short description. Clicking on the orange dot opens the report weblink on the SSDC where you can view or download the file. The reports are also available in the Tyhee Lake Watershed Collection on the SSDC.
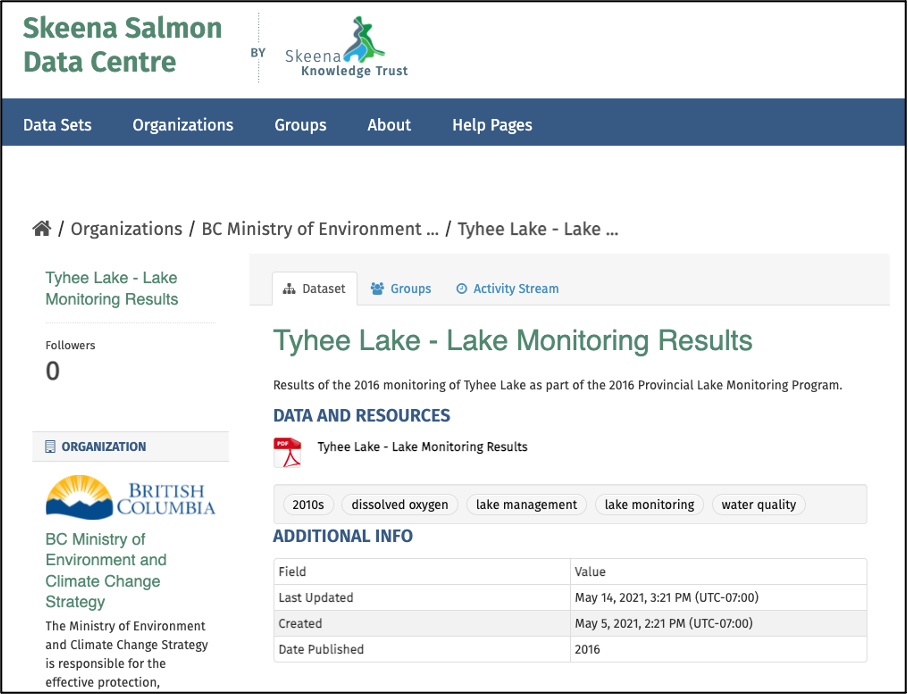
Report entry on the Skeena Salmon Data Centre
The third page presents a summary of water quality sampling results sources primarily from the Province of BC’s Environmental Monitoring System. Seymour Lake, Lake Kathlyn, and Tyhee Lake are all part of the BC Lake Monitoring Network, with consistent monitoring completed at the deepest point of the lake. However, the EMS also houses sampling results from previous monitoring programs (for instance the Tyhee 2018 Spring Melt Bacteria Sampling project). All available EMS sampling locations within the watershed are included on the Water Chemistry dashboard page.
Water quality parameters shown on the dashboard include standard parameters for freshwater ecosystem health (pH, temperature, dissolved oxygen, and turbidity (clarity)), nutrients associated with excessive algae/weed growth (nitrate, nitrite, and phosphorous), source drinking water parameters (hardness, colour, fecal coliform and E Coli), and contamination indicators (chloride and specific conductivity). A dropdown menu allows you to view results for each water quality parameter in the graph along with the respective BC Water Quality Guideline if available. Sampling results may also be filtered by site, year, site group, date, result value, and sample depth.
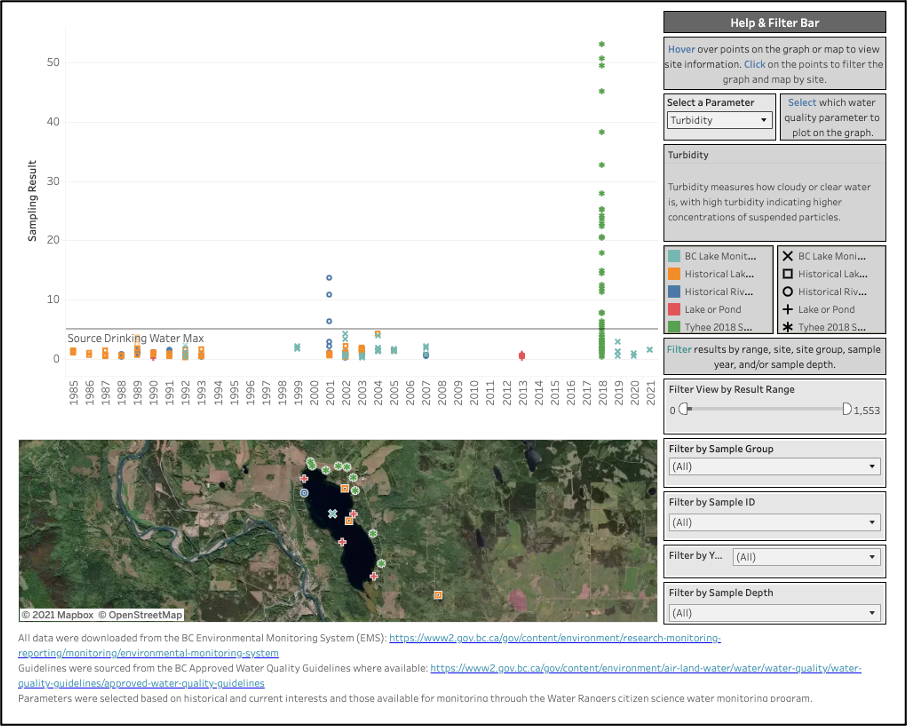
Water Chemistry Dashboard
Page four provides background information on the water quality samples including a breakdown of sample results by decade, sampling agency, and parameter.
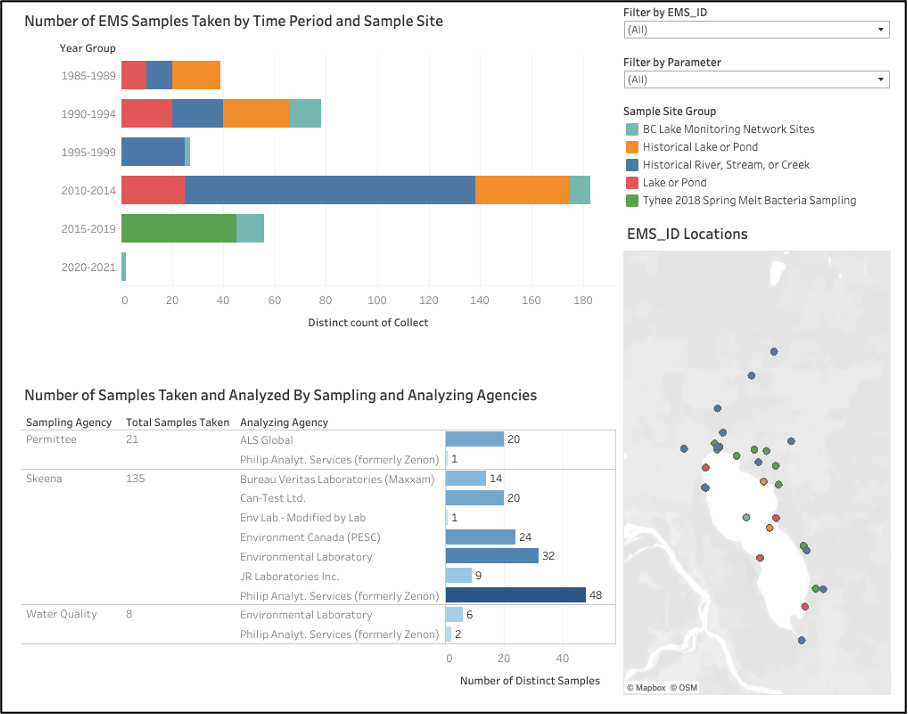
Water Sampling Information Dashboard
Page five shows the dissolved oxygen and temperature profile measurements collected by the Tyhee Lake Protection Society at the deepest point in Tyhee Lake in 2021. The lake was stratified in the summer, with warmer temperatures and higher dissolved oxygen content at the surface and very low oxygen levels below a depth of 10 meters. Fall turnover was underway by September with similar temperatures throughout the depth profile and increased dissolved oxygen levels down to 13 m by October. Images and links to background information on dissolved oxygen and seasonal stratification and mixing in lakes from DataStream is also provided on this dashboard.
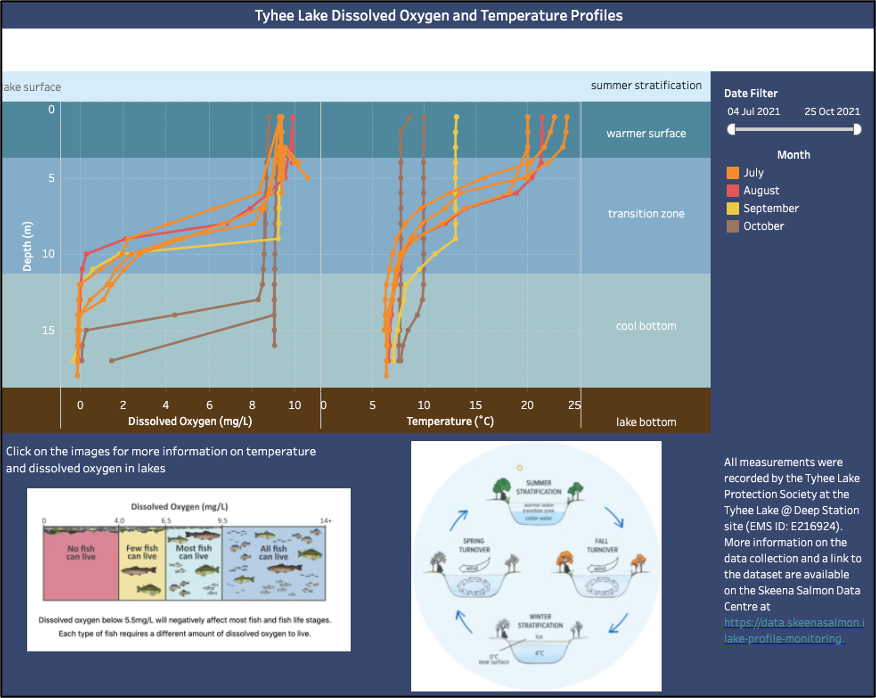
Dissolved Oxygen and Temperature Profiles
Page six shows a simple graph of ice off dates recorded by Tyhee Lake residents since 1981. Tyhee Lake ice off dates have ranged from April 4th in 2016 to May 9th in 1982.
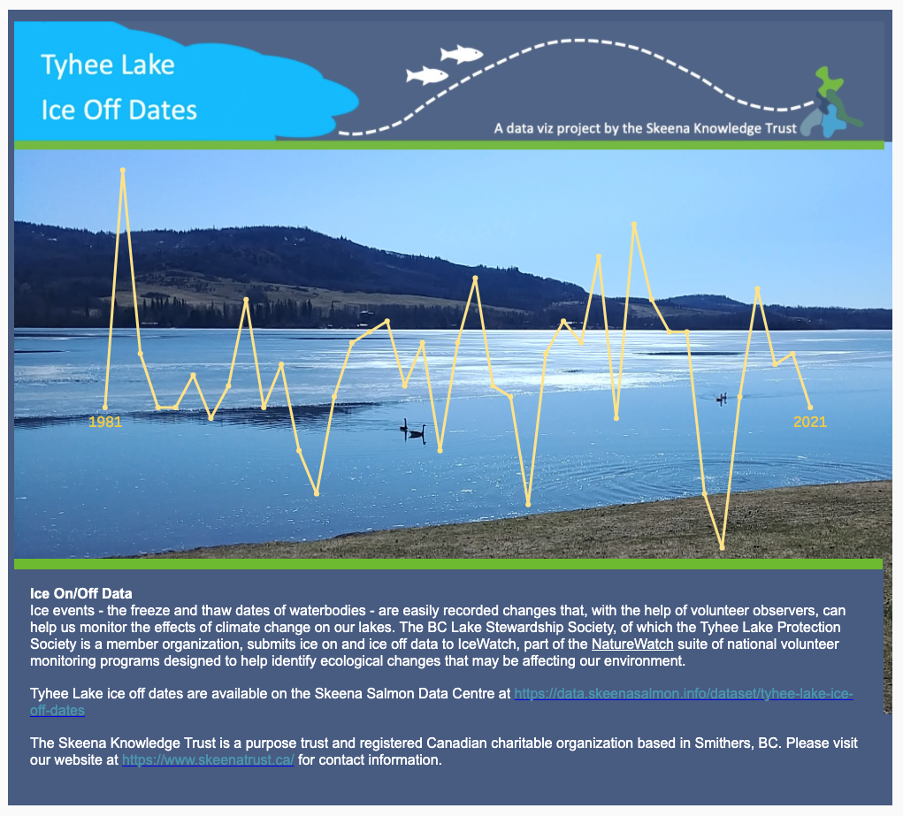
Ice Off Date Dashboard
The final dashboard page provides links to additional resources for lake information, references used in the dashboard, and contact information for the Skeena Knowledge Trust. We are excited to be working with Water Rangers in supporting citizen scientists through the provision of simple, easy-to-use water quality testing kits. Water Rangers has a fantastic portal designed specifically for uploading and sharing water quality testing results, which we are working to populate with data collected by our project partners.
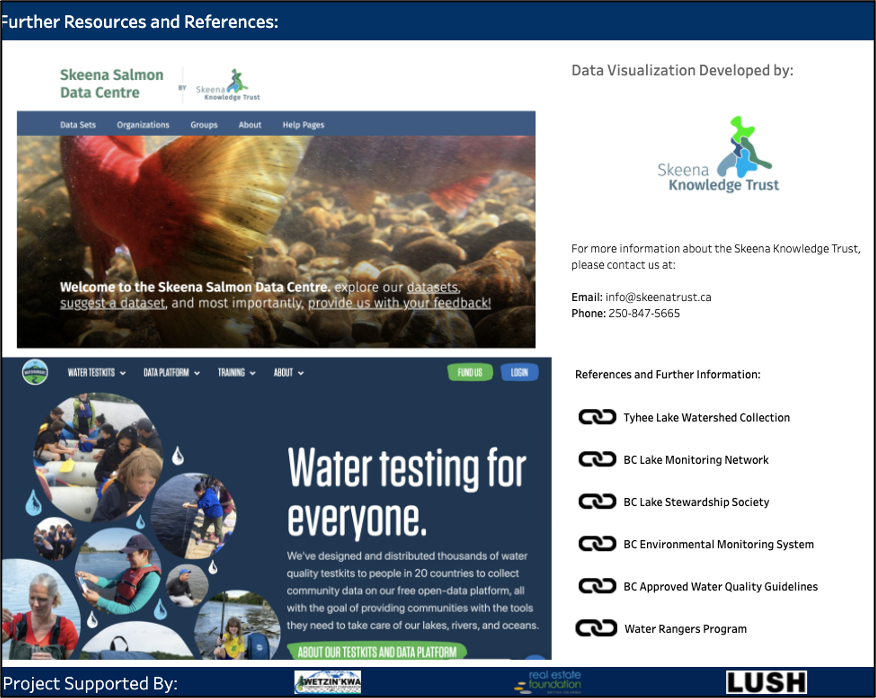
Further Resources and References Dashboard
Next Steps
We are continuing to update and maintain our What’s in our Watershed dashboards while looking for new partnerships and organizations in the Skeena interested in seeing their local watersheds featured in a dashboard.
Do you have any questions on how to use the dashboard or suggestions for how it could be improved? Please contact us at info@skeenatrust.ca.
Acknowledgements
Thank you to the Seymour Lake Conservation Society, Terry Stuart and the Lake Kathlyn Protection Society, Al Campbell, Don Morgan, Stephen Lockwood and the Tyhee Lake Protection Society for all your assistance and input!