For over three years, the Skeena Knowledge Trust has been hosting the water temperature monitoring data collected through Fisheries and Oceans Canada (DFO) Smithers’s Upper Bulkley Sockeye and Chinook Restoration Feasibility Study on the Skeena Salmon Data Centre. Funding support for the project was provided by DFO, the Pacific Salmon Commission, and the BC Ministry of Forests, Lands, Natural Resource Operations and Rural Development. The datasets consist primarily of hourly water temperature readings from fourteen sites in the Upper Bulkley River watershed upstream of the confluence with the Morice River, including several smaller streams and creeks as well as multiple points along the Bulkley River itself.
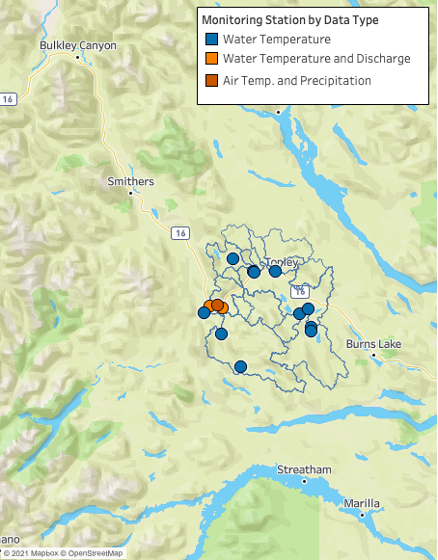
The Upper Bulkley River watershed with subwatersheds outlined in blue. The Bulkley River flows northwest to its confluence with the Skeena River west of the Bulkley Canyon. Monitoring stations in the watershed maintained by DFO, Water Survey of Canada, and Environmental and Climate Change Canada are shown by data type.
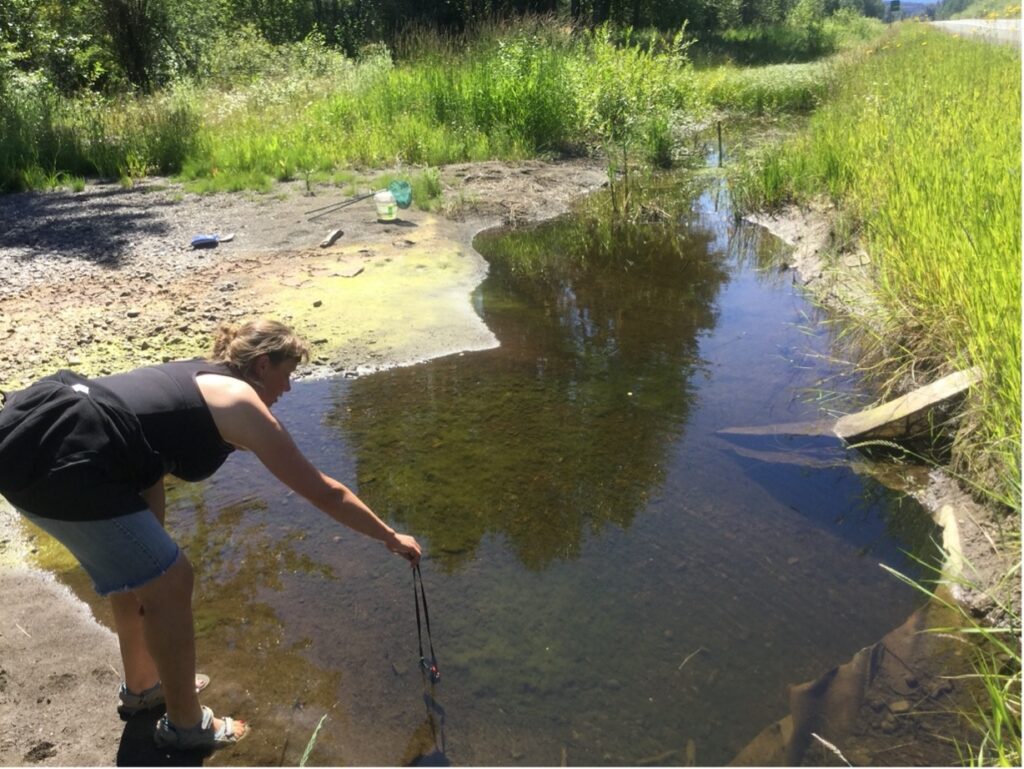
The Upper Bulkley River watershed in northwestern BC is an important salmon spawning habitat for fish species including chinook, coho, steelhead, and sockeye. Salmon have optimal temperature ranges for growth and survival that are lower than many other fish species and are expected to face increased challenges to survival as warmer temperatures and low water level conditions occur more frequently with the onset of climate change. In dryer years, salmon migrating back to their spawning beds are not able to make it past obstacles like the Bulkley Falls and may get trapped in pools when connecting streams dry up. The Upper Bulkley River watershed is also flatter and more disturbed in comparison with other subbasins in the Skeena River Watershed, with extensive agriculture and forest harvesting.
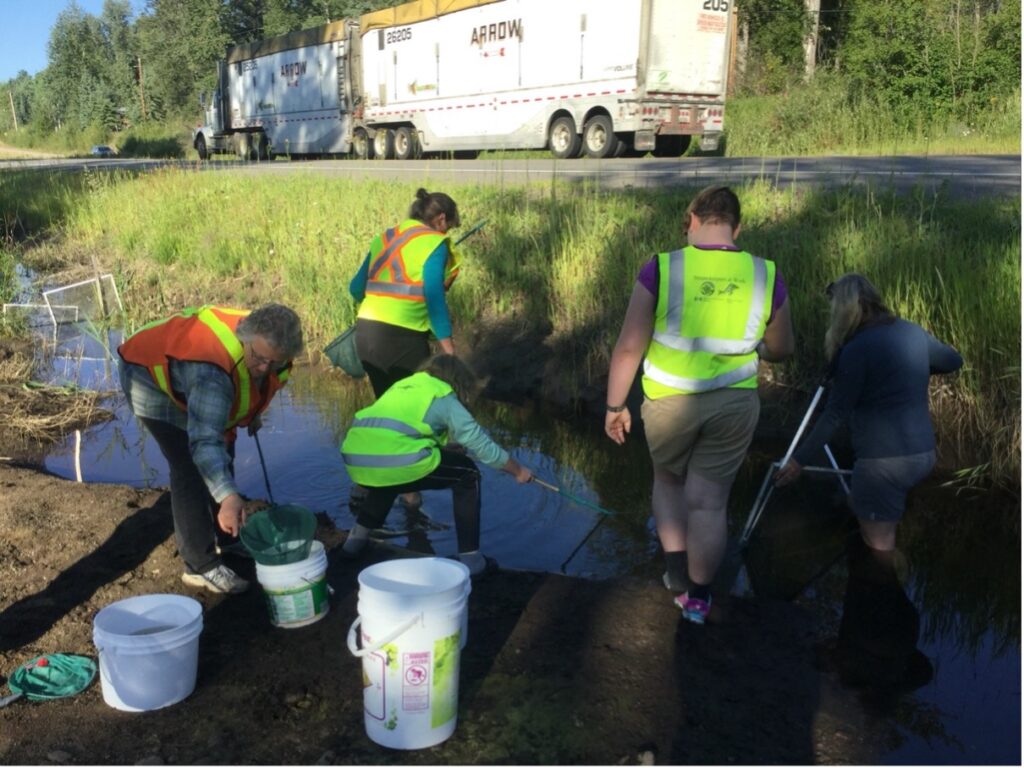
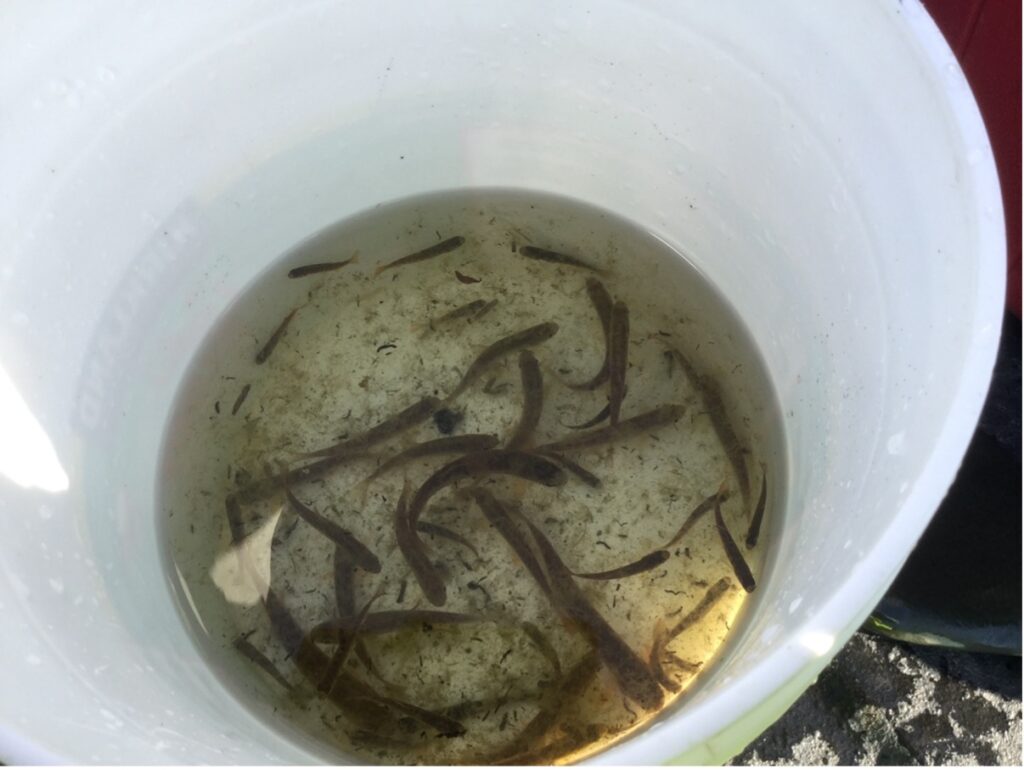
Houston A Rocha Streamkeepers work to rescue over 1,000 juvenile salmon from a pool on Barren Creek in the Upper Bulkley River watershed before it dried up (Photo Credit: Cindy Verbeek)
The water temperature monitoring program was implemented by DFO in 2016 to better understand fish habitat and inform mitigation strategies in the Upper Bulkley River watershed. Housing the data on the Skeena Salmon Data Centre as it became available through annual downloads of data loggers allowed DFO staff across departments and offices as well as external collaborators and researchers to view, download, and use the datasets to make proactive modifications to the study design and support ongoing streambank restoration efforts and other initiatives.
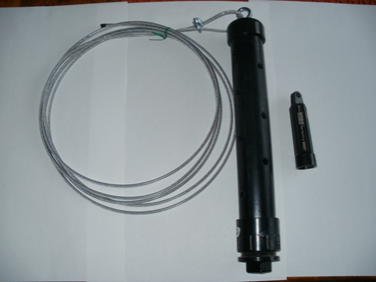
Example of a datalogger used to collect water temperature measurements (Photo Credit: Bob Westcott)
With three years of data now available for review and comparison and a summary report in the works, the Skeena Knowledge Trust took the opportunity to create an interactive dashboard to showcase the water temperature dataset and provide a tool for users to view and explore the information.
The raw data collected by water temperature data loggers consists of water temperature recordings with a corresponding time and date in a spreadsheet format. From this record, we can glean answers to such questions as how warm was the water in the creek or river and when was it the warmest? This process is most easily done by graphing the water temperature measurements on a chart and viewing the results visually rather than looking through thousands of numbers in a table. Calculating summary statistics such as daily maximum temperatures or weekly averages is another way of pulling key indicators out of large datasets.
By bringing in additional information such as site locations and optimal temperature ranges for different salmon species and life stages, we can ask more detailed questions, such as where are the warmest or coolest sites located within the watershed, what characteristics might influence water temperatures at certain sites, and are stream temperatures too warm for certain fish species at different life cycles?
While housing and maintaining the raw datasets on the Skeena Salmon Data Centre is crucial to ensure the data is available to support current and future initiatives and research in keeping with the FAIR Data Principles (Findable, Accessible, Interoperable, and Reusable), the Upper Bulkley River Water Temperature Monitoring Dashboard allows users to explore all the water temperature data collected through the DFO’s Upper Bulkley Sockeye and Chinook Restoration Feasibility Study without the extra step of downloading files or preparing graphs. The dashboard platform also provides users with extra functionality not available in a static report format such viewing graphs with a customizable threshold or zooming in on a particular date range of interest. All pages may be downloaded as images, pdf documents, MS powerpoint files, and/or spreadsheet format.
The Upper Bulkley River Water Temperature Monitoring Dashboard is available online here and we gratefully acknowledge the financial support of the BC Healthy Watersheds Initiative for the development of the tool.
Dashboard Description
The first page of the dashboard provides an introduction and overview of the project and the Upper Bulkley River Watershed. Subsequent pages are shown along the top menu and can be selected to move between the different pages.
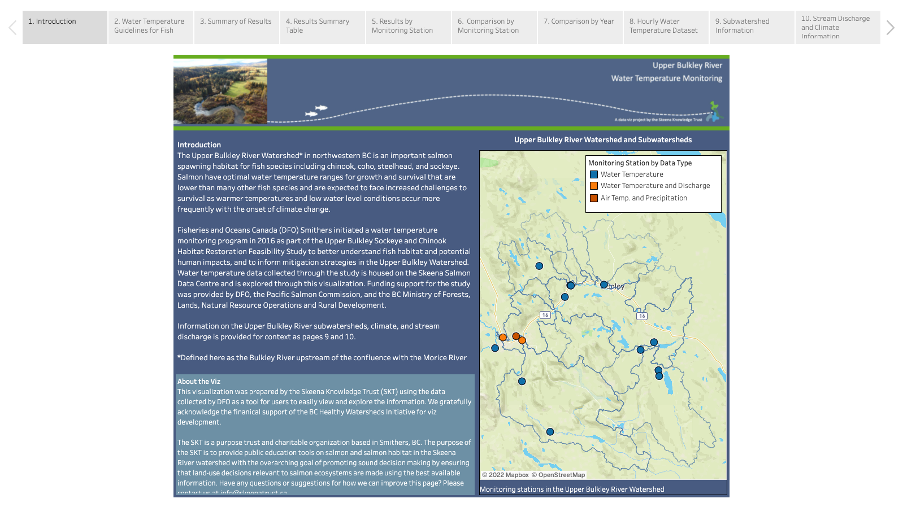
Introduction page showing the top menu selection panel
Water temperature guidelines developed by the Province of BC for freshwater aquatic life are summarized on the Water Temperature Guidelines for Fish page, which include optimum temperature ranges for specific life history stages of salmonids (incubation, rearing, migration, and spawning) and guidelines based on the Mean Weekly Maximum Temperature (calculated as the average of the warmest daily maximum temperature for 7 consecutive days). Estimations of timing windows for each life stage for chinook, coho, sockeye, and steelhead in the Upper Bulkley watershed are also provided on this page.
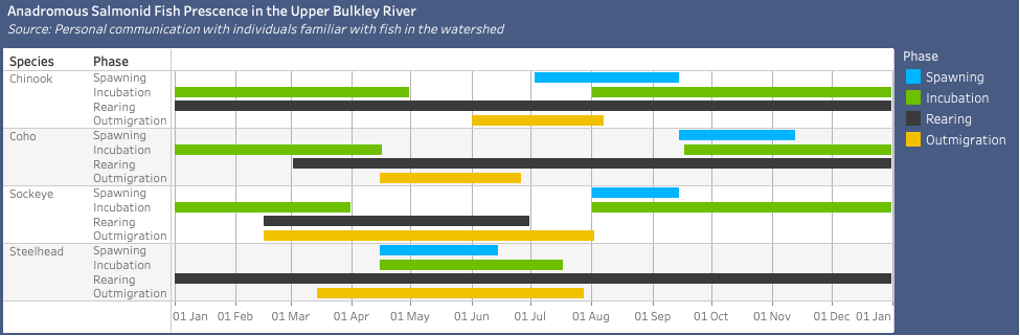
Portion of the Water Temperature Guidelines for Fish page showing estimations of salmonid fish presence timing for chinook, coho, sockeye, and steelhead
The Summary of Results page presents a high-level overview of the water temperature results by peak Mean Weekly Maximum Temperature (MWMT) for all sites. By toggling the Year filter and hovering over the results shown in the bar graph, we can see that:
- The peak MWMT at nine of the thirteen monitoring stations exceeded the default BC guideline for water temperature (18°C) in the warmest year on record (2018);
- The peak MWMT at three of the eight monitoring stations for which there was data exceeded 18°C on the coolest year on record (2020);
- The Bulkley River mainstem monitoring stations were consistently warmer than the upstream creek sites; and
- Buck Creek subwatershed monitoring stations were generally warmer than sites in the other monitored subwatersheds.

Summary of Results page

2 The Bulkley River below Bulkley Lake monitoring station had the warmest peak MWMT over the monitoring period (Photo Credit: Bob Westcott)
3 The Foxy Creek monitoring station had the coolest peak MWMT over the monitoring period (Photo Credit: Bob Westcott)
Results are also summarized by peak MWMT in a table format on the Results Summary Table page with options to view the key indicator summarized by year, month, or week. This page allows users to quickly gain a sense of how frequently the peak MWMT exceeded the threshold, how many weeks the threshold was exceeded, and by how much. For instance, MWMTs at the Buck Creek Above Bridge 1 monitoring station were above the default BC guideline for water temperature (18°C) for seven weeks in July and August of 2018.
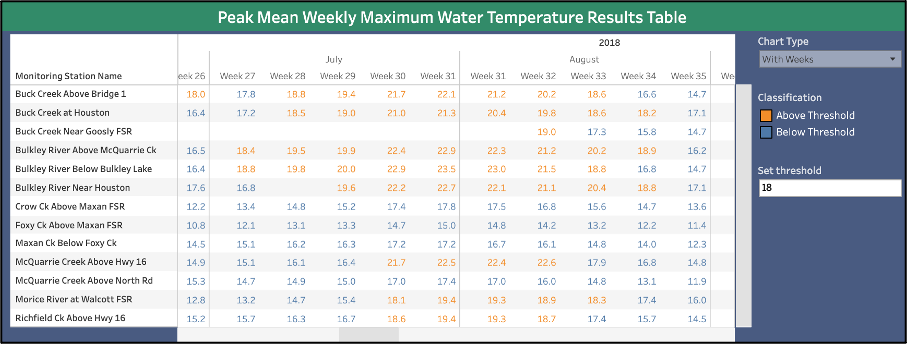
Results Summary Table page showing weekly peak MWMT for July and August of 2018
Detailed water temperature graphs are presented on the Results by Monitoring Station, Comparison by Monitoring Station, and Comparison by Year pages. These pages have graphs of the MWMT at each site over time with reference maps functioning as filters to quickly make the connections between each monitoring station and its relative location within the watershed. The Results by Monitoring Station chart shows one monitoring station as a time and has daily maximum temperatures graphed as well as MWMT.
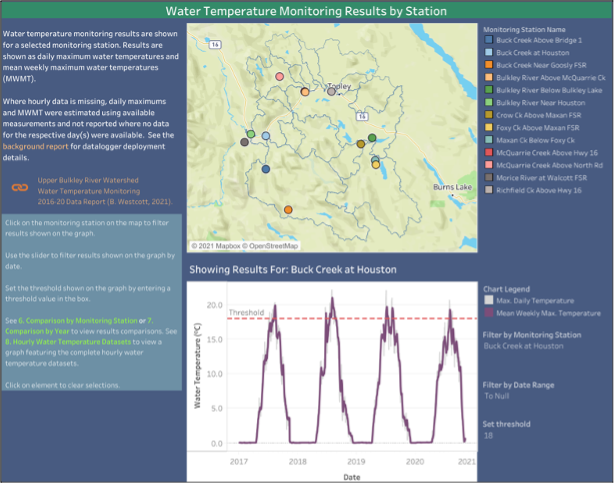
Results by Monitoring Station Page showing MWMT and maximum daily temperature results for the Buck Creek at Houston monitoring station
The Comparison by Monitoring Station page allows users to customize the chart by viewing results from multiple monitoring stations on a single graph as well as providing the option to add Mean Weekly Air Temperatures measured at the Environment and Climate Change Canada station in Houston, BC.
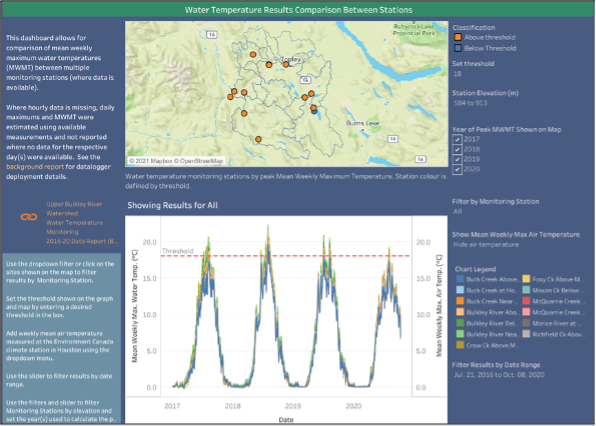
Comparison by Monitoring Station page showing MWMT results for all monitoring stations
The Comparison by Year page allows users to view MWMT results for multiple years for a single site on the same graph with customizable reference bands based on fish species and life stage for chinook, coho, steelhead/rainbow, and sockeye. This page allows users to visually compare results from year to year as well as easily identify whether water temperatures have the potential to negatively impact particular salmonid species development and survival. For instance, water temperatures at the Buck Creek at Houston monitoring station were consistently warmer than the maximum optimum temperature for spawning for chinook (13.9°C) during July and August when chinook typically spawn in the Upper Bulkley River Watershed, shown as the intersection of the light orange and grey bands on the image below. However, the water temperatures measured at the Buck Creek at Houston monitoring station were generally within the optimum temperature range for spawning for coho (4.4-12.8°C), as coho typically spawn later in the year.
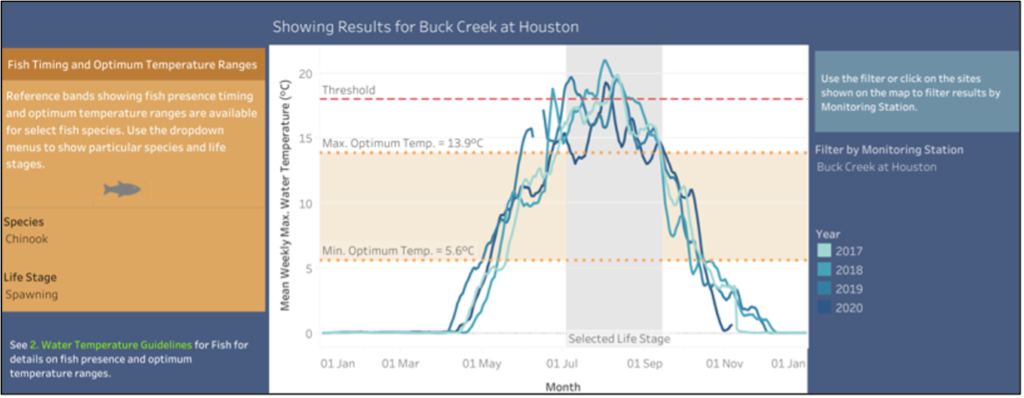
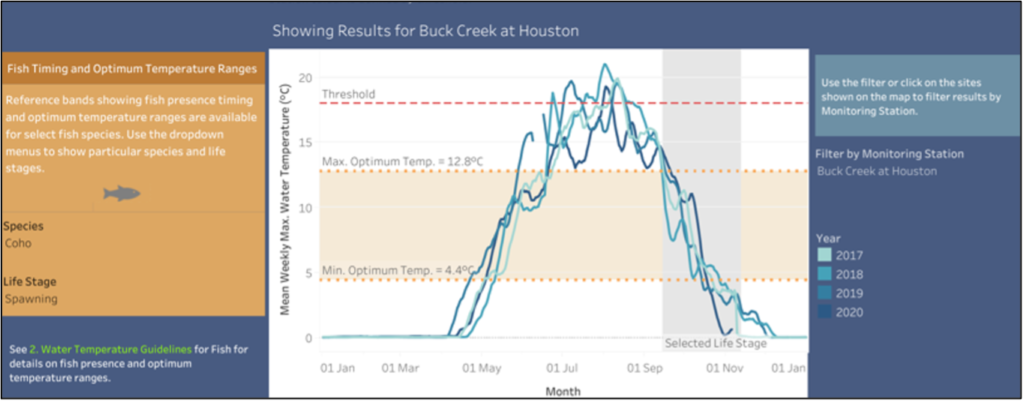
Comparison by Year page showing MWMT results for the Buck Creek at Houston monitoring station with fish presence timing (grey band) and optimum temperatures ranges (orange band) during spawning for chinook (top) and coho (bottom)
Unaggregated hourly temperature datasets for each site are also available to explore on the Hourly Water Temperature Dataset page. These charts show the individual water temperature measurements recorded by the dataloggers every hour and coloured based on the chosen threshold. As on all the other pages, users can query individual measurements by hovering over lines on the graph with their mouse to reveal additional information in a tool tip.
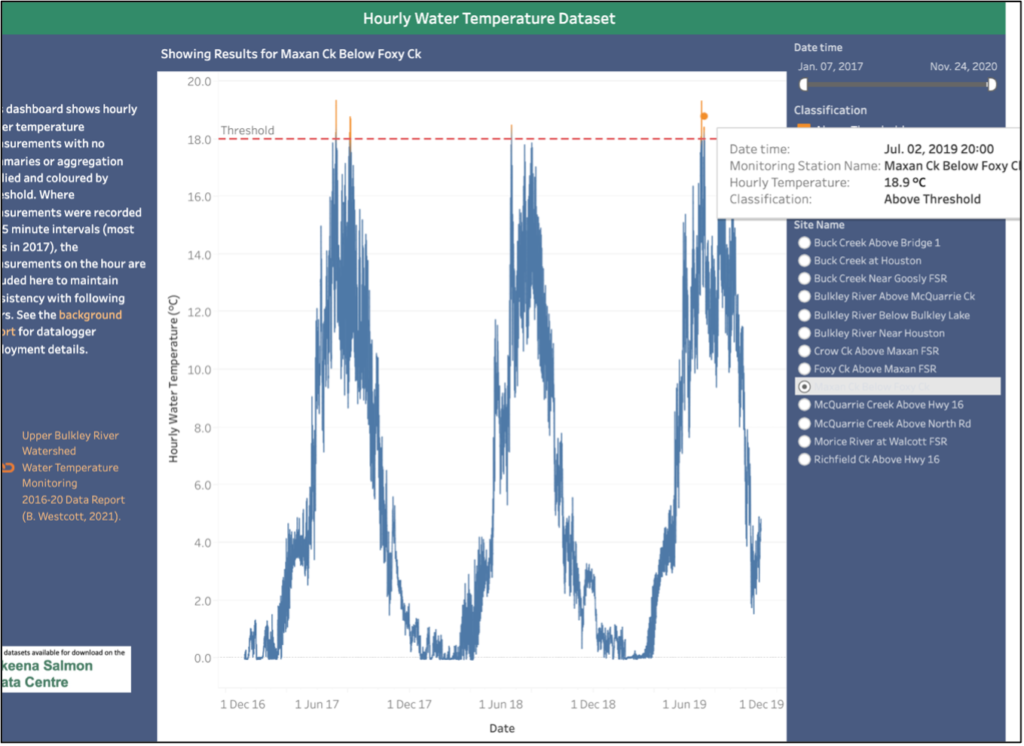
Hourly Water Temperature Dataset page showing results for the Maxan Creek Below Foxy Creek monitoring station with measurement data shown in the tool tip
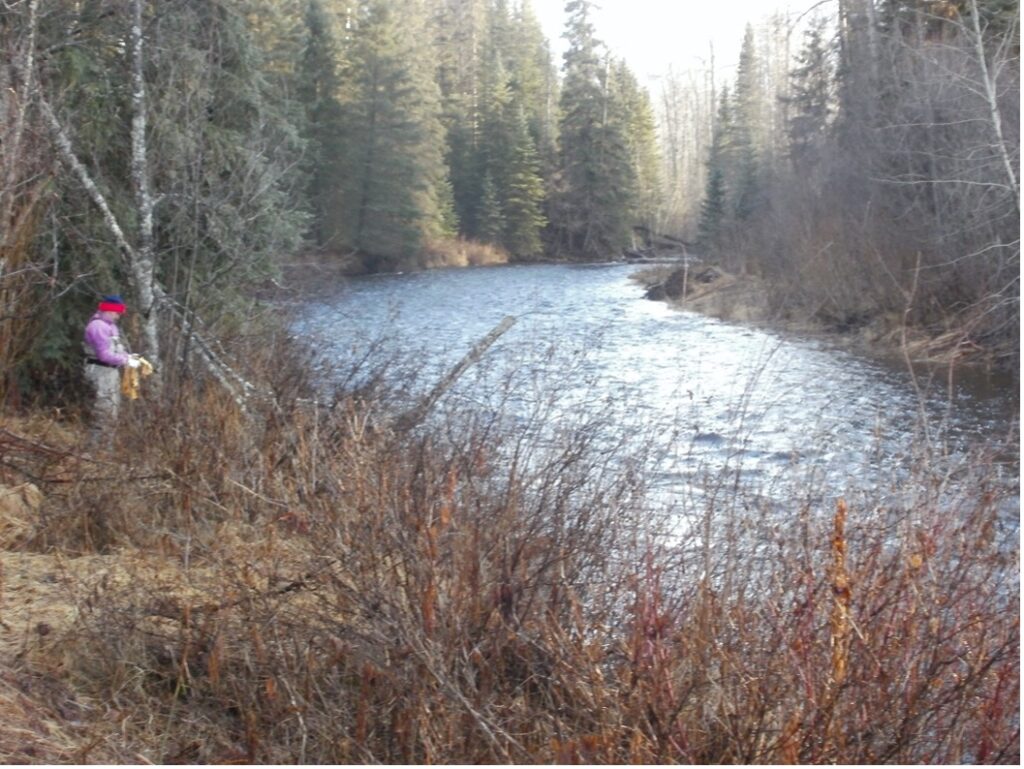
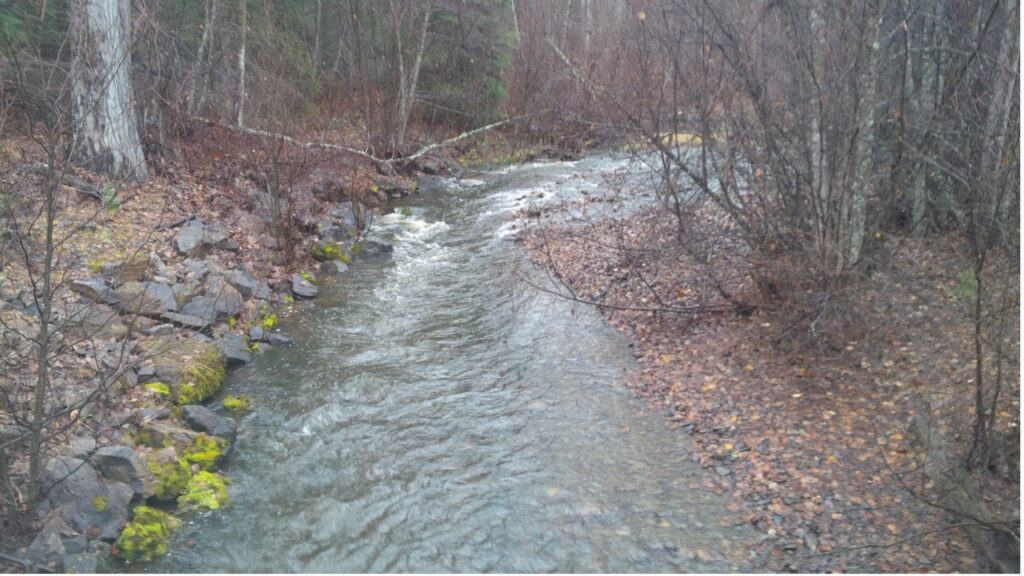
4 Maxan Creek below Foxy Creek monitoring station (Photo Credit: Bob Westcott)
Contextual information on the monitoring stations and Upper Bulkley River subwatersheds is provided on the Subwatershed Information tab. The map element shows aerial imagery of the Upper Bulkley River Watershed with subwatersheds coloured by Total Land Cover Alteration (TLCA) – a metric identified by Canada’s Wild Salmon Policy as a key salmon habitat pressure indicator. The entire Upper Bulkley River Watershed has a moderate to high level of disturbance, with subwatershed TLCA ranging from 20.7% to 94.4% in 2016. Details on subwatershed size, TLCA, principle land uses, proportions of total watershed discharge, and water allocations are provided in the upper table, while information pertaining to monitoring stations including aspect, elevation, and rationale for site selection are provided in the lower table.
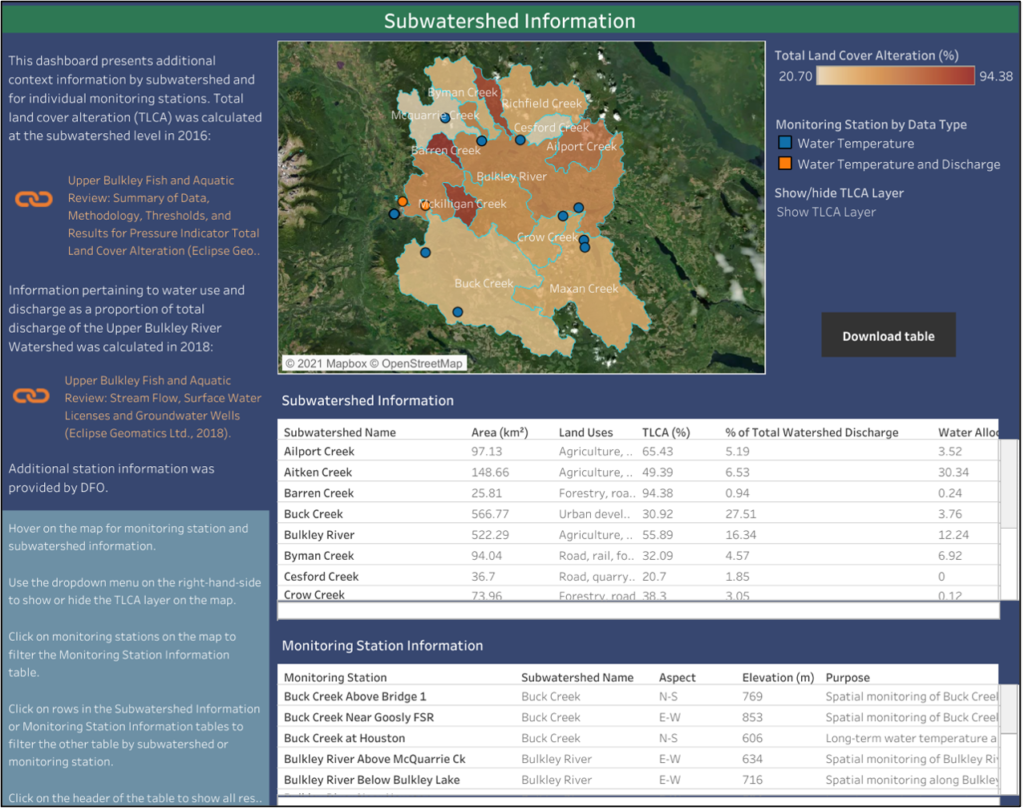
Subwatershed Information page
Finally, stream discharge measured at the Bulkley River Near Houston and Buck Creek at the Mouth Water Survey of Canada stations for 2017-2020 along with historical minimum and maximum records are included with historical climate information from the Environment and Climate Change station in Houston on the Stream Discharge and Climate Information page. Both the Upper Bulkley River and Buck Creek have flow regimes dominated by spring freshet with low flows the remainder of the year punctuated by occasional summer rainstorms and fall rain events.
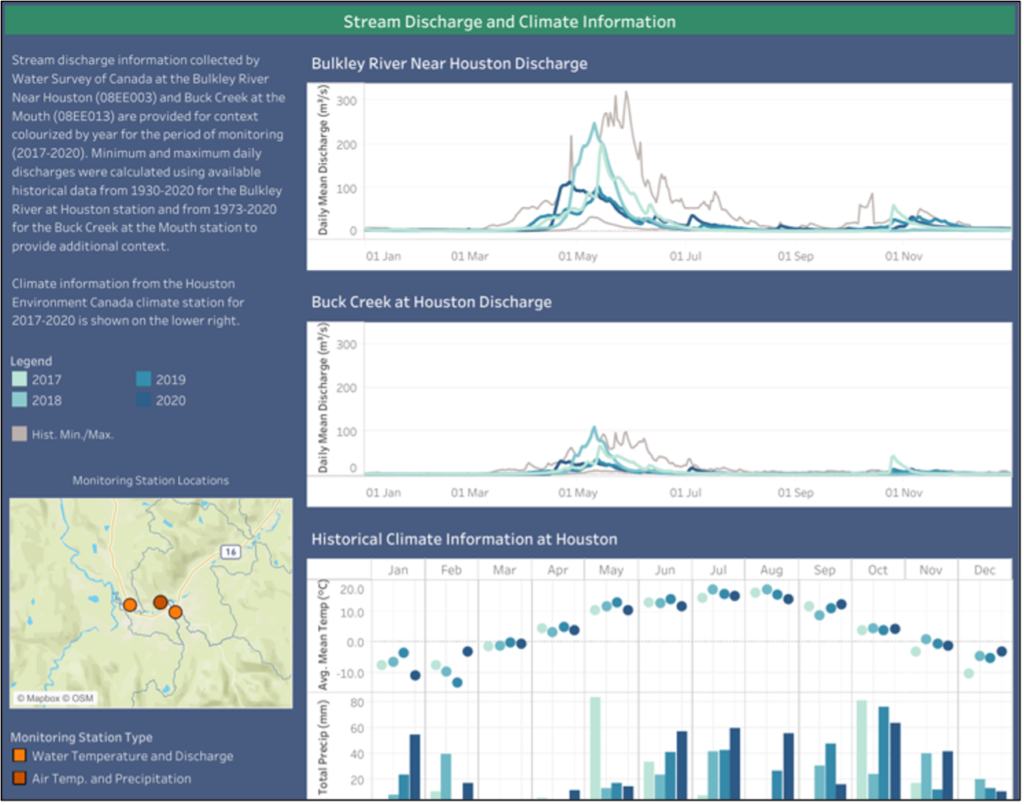
Stream Discharge and Climate Information page
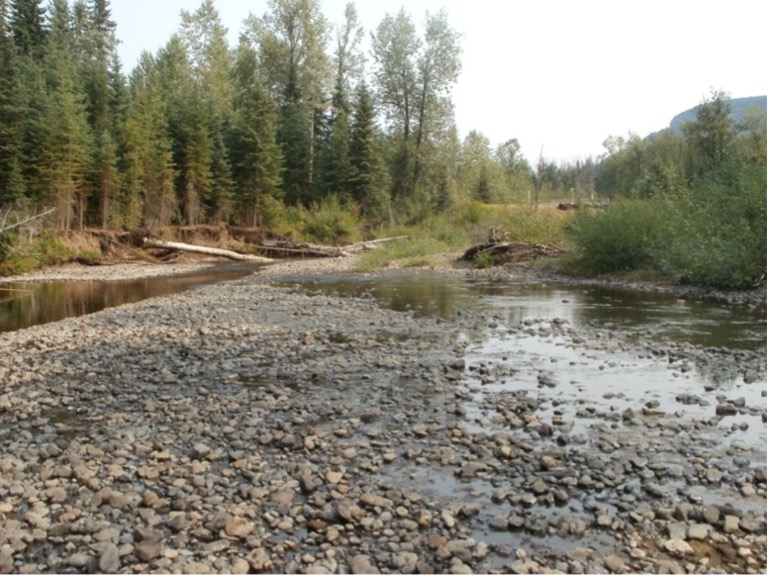
6 Buck Creek above Bridge 1 during a low flow (Photo Credit: Bob Westcott)
A technical report on the Upper Bulkley Temperature Monitoring is currently under review and will provide a more in-depth assessment of the water temperature monitoring results briefly outlined here.
Next Steps
Water temperature monitoring has been recognized as a critical component of adaptive watershed management especially with regards to climate change mitigation and fish habitat restoration. The learnings and technical expertise gained through the development of the Upper Bulkley River Water Temperature Monitoring Dashboard will allow the Skeena Knowledge Trust to build out the dashboard to include other monitoring stations across the Skeena watershed and paint a more complete picture of the challenges and opportunities facing salmon in the Skeena.
Do you have any questions on how to use the dashboard or suggestions for how it could be improved? Please contact us at info@skeenatrust.ca.
Acknowledgements
Thank you to Cindy Verbeek of the A Rocha Houston Streamkeepers for the use of her photos in this article and especially to Bob Westcott for all the ideas and feedback he provided over the course of the dashboard development and for providing site photos for this article.