Every year adult Skeena salmon make the incredible journey of hundreds of kilometers to return to the streams where they were born after a year or more in the Pacific Ocean. As climate change adds additional challenges to salmon survival, it is more important than ever to know how many salmon are making it back to spawn the next generation. The Skeena River Watershed in northwestern British Columbia is the second largest salmon-bearing watershed in the province and it is impossible to overstate how important Skeena salmon are to Indigenous culture and food security, local economies, and community identity. Returning salmon also provide key ecological functions as food for wildlife including Grizzly Bears and as nutrients for forests and aquatic ecosystems.
To make adaptive management decisions, fisheries managers need to know how many salmon are coming back and estimate the size of the salmon run as it happens. This can be quite challenging as there are tens of thousands of fish representing six salmonid species (chum, coho, chinook, pink, sockeye, and steelhead) making their way up the Skeena River to their spawning beds. Methods used to count returning salmon include tagging, fish fences, and using test fisheries such as the Tyee Test Fishery operated by Fisheries and Oceans Canada (DFO) at the mouth of the Skeena River.
The premise of a test fishery is that a net is set for a certain length of time – usually three one-hour sets a day in the case of the Tyee Test Fishery – and the number of fish caught per hour of fishing effort is recorded. This “daily index” is considered proportional to the total number of fish swimming past on a given day. Where additional information is known, such as individual fish counted further upstream, the “catchability” of certain fish species may be inferred, which support estimations of total fish numbers based on the daily index. The total number of fish that “escape” fisheries and return to freshwater is call “escapement”.
Salmon runs have been monitored by DFO at Tyee using a gill net test fishery since 1955.
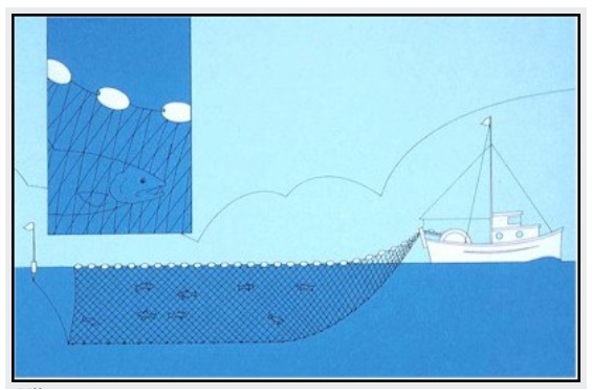
The gill net used at the Tyhee fishery is allowed to drift within a 2 to 5 km long, 0.8 km wide channel that runs parallel to the northern shoreline of the Skeena River. Set times vary according to tide height and river discharge and are made on both highwater and low water slack during daylight hours.
Daily escapement estimates are calculated for sockeye salmon based on the most recent 3-year average annual catchability value. Although escapements are not calculated for other species (chinook, coho, chum, pink, and steelhead), daily indices provide information on relative abundance and timing when compared with previous years.
Daily escapements for sockeye and daily indices for all salmon species are available from the DFO in real-time at the Daily Tyee Test Fishing Salmon Index Summary and Daily Tyee Test Fishing Sockeye Escapement Report pages as well as historical data from the previous ten years.
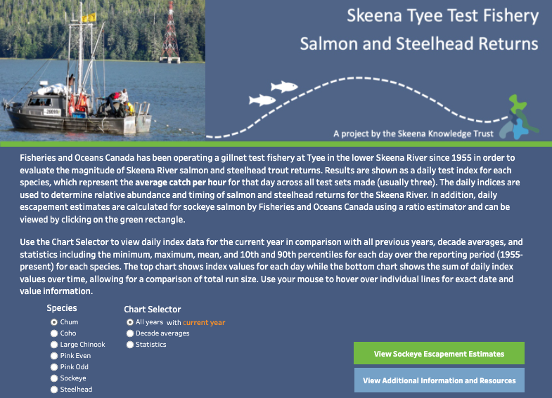
In 2020, the Skeena Knowledge Trust took the initiative to bring all the Tyee Test Fishery data provided by DFO into an interactive online graph and visualization with guidance from local fisheries biologists. The goal of the project was to provide users, including fisheries managers and researchers, with a dashboard showing current year sockeye escapements and daily indices for each salmonid species in relation to historical numbers. The Skeena Tyee Test Fishery Salmon and Steelhead Returns dashboard is available here.
Dashboard Description
A selector menu at the top of the dashboard allows users to toggle between the different salmonid species observed at the Tyee Test Fishery (chum, coho, large chinook, pink even years, pink odd years, sockeye, and steelhead) as well as between the different chart types (All Years with Current Year, Decade Averages, and Statistics). The chart on the top shows the daily indices recorded for each day and illustrates the shape and timing of the selected salmon run. The chart on the bottom shows the cumulative daily index, calculated as a running total of all the previous daily indices for each day. The level at which the cumulative index flattens off once all the fish have passed by the test fishery gives an indication of the total size of the selected salmon run.
On the All Years with Current Year chart, current year daily indices are shown in orange while all previous years on record are shown in light grey. Users can hover over the data series to find out the exact year, day, and daily index for each record. You can see the chum run for 2021 was the lowest on record.
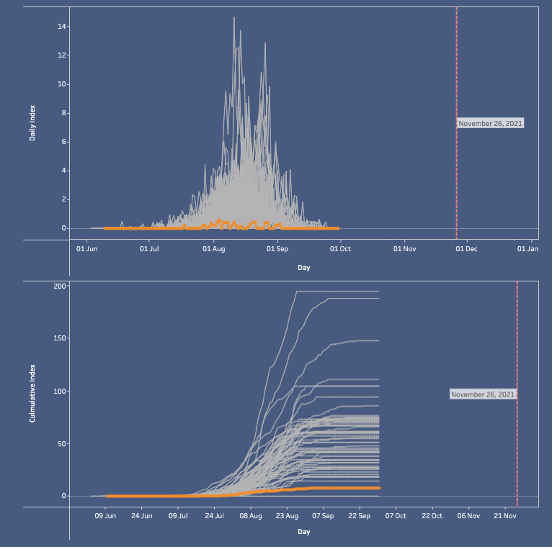
Tyee Test Fishery Salmon and Steelhead Returns dashboard showing current year results for chum (orange) in comparison with previous years on record (light grey)
The Decade Averages chart shows the current year daily indices in orange with daily index averages for each decade shown in shades of purple.
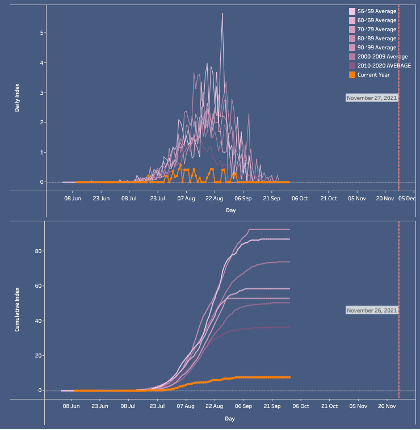
Tyee Test Fishery Salmon and Steelhead Returns dashboard showing current year results for chum (orange) in comparison with decade averages (purple)
Summary statistics including maximum, 90th percentile, mean, 10th percentile, and minimum daily and cumulative index were calculated for each day on record, and are shown on the statistics chart in blue with current year in orange.
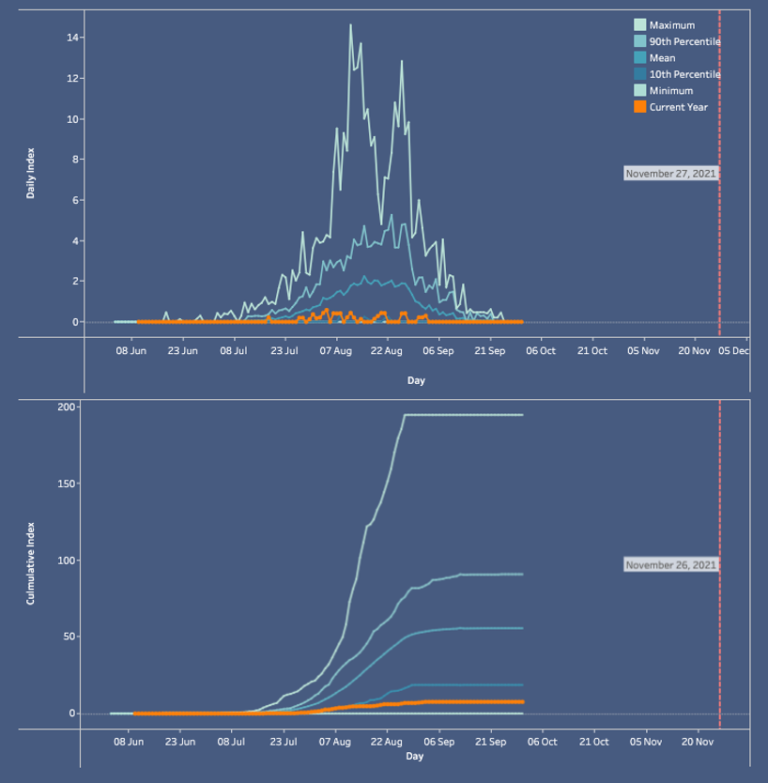
Tyee Test Fishery Salmon and Steelhead Returns dashboard showing current year results for chum (orange) in comparison with summary statistics (blue)
Escapement estimates for sockeye are available on the Sockeye Salmon Escapement Estimates page, with the same chart options as those provided for daily indices. A cumulative escapement of just over 1,000,000 sockeye salmon was recorded for 2021.
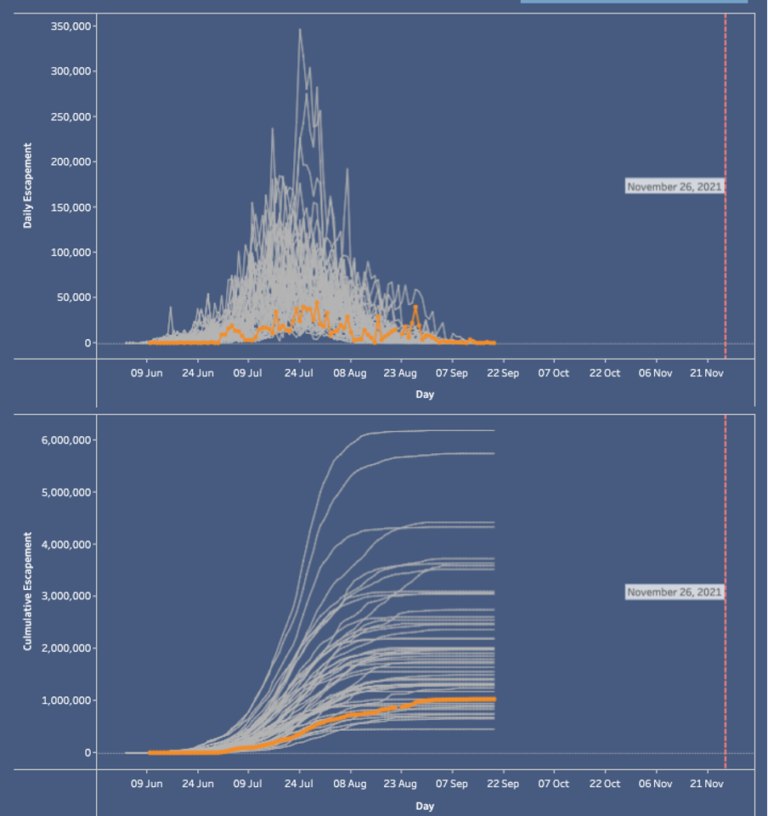
Sockeye Salmon Escapement Estimates page showing current year sockeye escapement estimates (orange) in comparison with previous years on record (light grey)
Links to the original data webpages and the source data sheet used by the Tyee Test Fishery Salmon and Steelhead Returns dashboard on the Skeena Salmon Data Centre are provided on the Additional Information and Resources page. A link to the SkeenaWild Fishing App is also provided, which presents users with the Tyee Test Fishery data in an app format.
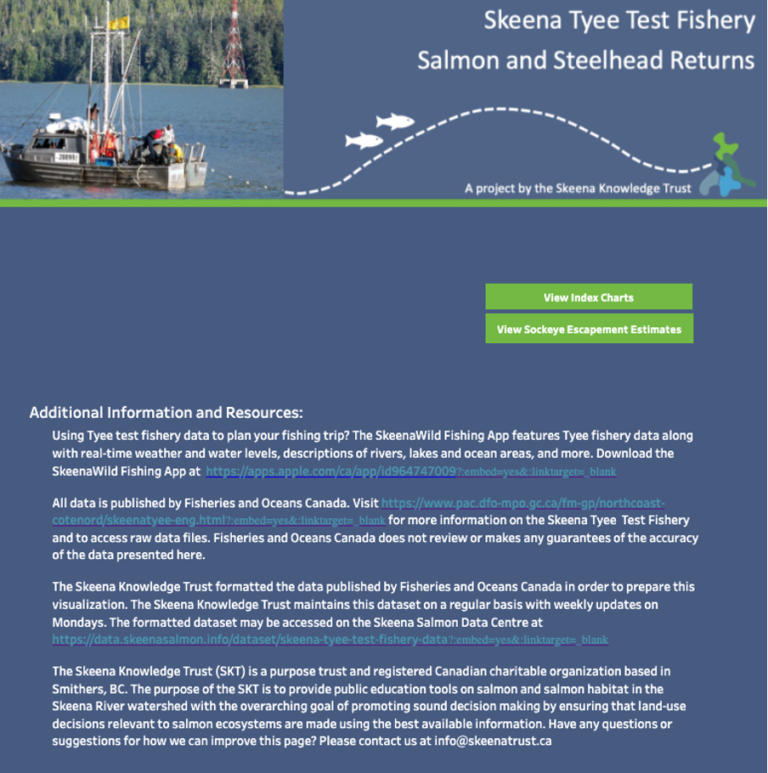
Additional Information and Resources page
Next Steps
There are many other fish counting stations in the Skeena River watershed with current and historical information on salmon runs in specific subwatershed such as smolt counts at the Babine Lake fish fence during the Invisible Migration. Incorporating these datasets into the dashboard would provide more information on specific salmon conservation units and survival rates and provide a more complete picture of Skeena salmon migration and survival.
Do you have any questions on how to use the dashboard or suggestions for how it could be improved? Please contact us at info@skeenatrust.ca.
Acknowledgements
Thank you to Andy Rosenberger for providing the historical datasets and invaluable input into the conceptual design of the Tyee Test Fishery Salmon and Steelhead Returns dashboard and to Reine Vizcarra and Claire Thornton for their patient troubleshooting and nursing the dashboard to life.